雅思考试写作中,会遇到饼状图的题目,没有准备的小伙伴是不是感觉无从下手呢,不要着急哦,下面是小编偷师到的雅思写作考官教你饼状图的写作思路和方法,需要雅思机经的小伙伴们还不速速收藏。
Describing an IELTS Pie Chart
This lesson will provide you with tips and advice on how to write an IELTS pie chart for task one.
To begin, take a look at the pie chart below and the model answer.
You should spend about 20 minutes on this task.
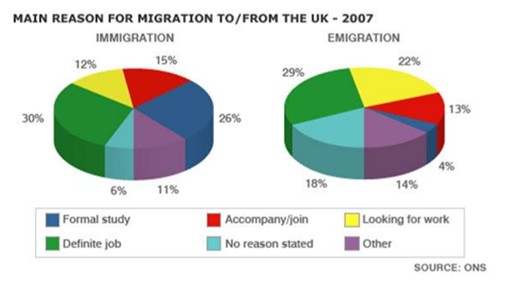
The pie charts show the main reasons for migration to and from the UK in 2007.
Summarize the information by selecting and reporting the main features and make comparisons where relevant.
Write at least 150 words
Sample Answer
The pie charts illustrate the primary reasons that people came to and left the UK in 2007.
At first glance it is clear that the main factor influencing this decision was employment. Having a definite job accounted for 30 per cent of immigration to the UK, and this figure was very similar for emigration, at 29%. A large number of people, 22%, also emigrated because they were looking for a job, though the proportion of people leaving the UK for this purpose was noticeably lower at less than a fifth. Another major factor influencing a move to the UK was for formal study, with over a quarter of people immigrating for this reason. However, interestingly, only a small minority, 4%, left for this.
The proportions of those moving to join a family member were quite similar for immigration and
emigration, at 15% and 13% respectively. Although a significant number of people (32%) gave ‘other’ reasons or did not give a reason why they emigrated, this accounted for only 17% with regards to immigration.
173 words
_________________________________________
As you can see, the pie chart description is easy to follow.
Here are some key points in organizing your answer.
1. Choose the most important points to write about first.
These will be the largest ones. As you can see in the model answer, definite job, looking for work, and formal study were all written about first, in order of importance, as these are the main reasons that were chosen for moving.
Items such as ‘other’ are usually less important and account for small amounts, so can be left till the end.
2. Make it easy to read
When you write a task 1, you should always group information in a logical way to make it easy to follow and read.
With an IELTS pie chart, the most logical thing to do is usually to compare categories together across the charts, focusing on similarities and differences, rather than writing about each chart separately.
If you write about each one separately, the person reading it will have to keep looking between the paragraphs in order to see how each category differs. As you can see in the model answers, each category is discussed in turn, not each pie chart.
3. Vary your language
As with any task 1, this is important. You should not keep repeating the same structures. The key language when you write about pie charts is proportions and percentages.
Common phrases to see are "the proportion of..."or "the percentage of..."
However, you can also use other words and fractions. These are some examples from the model answer:
A large number of people
over a quarter of people
a small minority
A significant number of people
less than a fifth
This table presents some examples of how you can change percentages to fractions or ratios:
|
Percentage |
Fraction |
|
80% |
four-fifths |
|
75% |
three-quarters |
|
70% |
seven in ten |
|
65% |
two-thirds |
|
60% |
three-fifths |
|
55% |
more than half |
|
50% |
half |
|
45% |
more than two fifths |
|
40% |
two-fifths |
|
35% |
more than a third |
|
30% |
less than a third |
|
25% |
a quarter |
|
20% |
a fifth |
|
15% |
less than a fifth |
|
10% |
one in ten |
|
5% |
one in twenty |
If the percentages are not exact as above, then you can use qualifiers to make sure your description remains accurate. Here are some examples:
|
Percentage |
Qualifier |
|
77% |
Approximately three quarters |
|
49% |
just under a half/ nearly a half |
|
32% |
Almost a third |
This table presents some examples of how you can change percentages to other phrases:
|
Percentage |
proportion / number / amount / majority / minority |
|
75% -85% |
a very large majority |
|
65% -75% |
a significant proportion |
|
10% -15% |
a minority |
|
5% |
a very small number |
The words above are interchangeable, though number is for countable nouns and amount is for uncountable nouns.